Almost every L&D function reports against one headline number: hours of training delivered. It shows up in dashboards, in annual reports, in budget discussions. Yet of all the L&D metrics a function could track, this one says the least.
Other parts of the business wouldn't get away with reporting hours spent on an activity. Finance doesn't report hours spent on bookkeeping. Sales doesn't report calls made. Marketing stopped reporting impressions a decade ago. Every function reports outcomes. Except L&D.
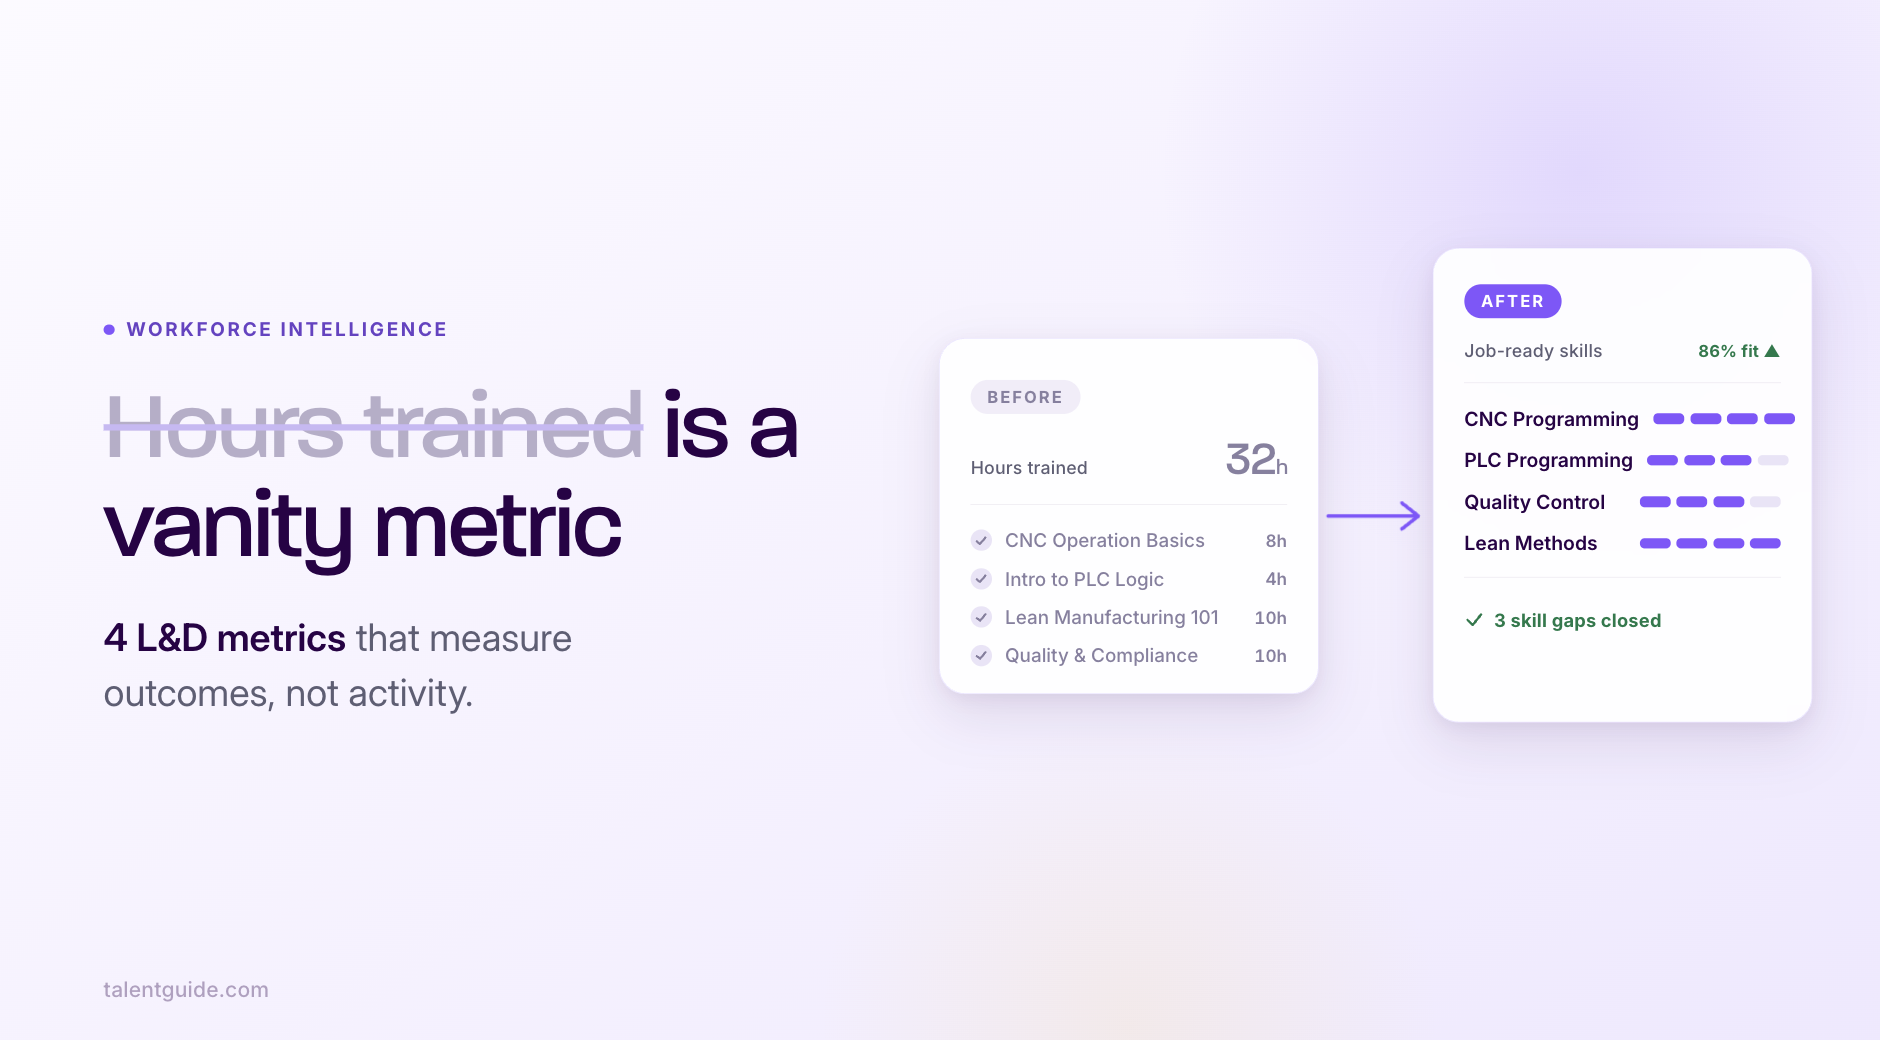
Why is hours trained a problematic metric?
There is a body of evidence for what poor skill coverage costs. McKinsey reports that productivity can decline by up to 22% when employees lack the right skills. That's not a vague HR claim, that's business impact. And hours trained just doesn’t speak to an outcome, but to a process. The time employees spent in training does not tell whether skills were gained and productivity increased.
Why does "hours" stay dominant anyway?
Because it’s an easy metric to track.
It auto-collects from any LMS. It doesn't require a skills inventory or a competency model. It doesn't require anyone to decide what "good" looks like before the training starts. It's politically safe. It says nothing about whether the function works.
Outcome metrics are uncomfortable. They show when L&D does have impact, and when it doesn't. Luckily there’s alternatives!
4 L&D metrics that measure outcomes, not activity
Four metrics replace hours trained. Read them as a sequence, not a list. Each one answers a question the previous one raises.
- Coverage of critical roles. What percentage of your business-critical roles have full skill coverage today? This tells you where the workforce can't deliver. It's the location of the risk.
- Time-to-proficiency. Once you know the gaps, the next question is how fast you can close them. How long does it take an employee to reach the required level on a critical skill? Shorter means the workforce absorbs change faster. This tells you whether closing a gap takes a quarter or a year.
- Internal redeployment rate. Speed is only useful if the workforce actually moves. How many employees moved internally into roles where they deliver more value? This tells you whether the training translated into people landing where the business needs them.
- Gap-closure rate. Movement is only useful if it shrinks the gap you started with. How many skill gaps that were open at the start of the quarter are closed now? This is the metric the function should be willing to defend at the next executive review. It's the bottom line.
Four metrics. One chain: where the gap is, how fast you close it, whether people move, whether the gap actually shrinks. Each one shifts the L&D conversation from "the program ran" to "the function moved this number in this direction."
How to measure L&D effectiveness next quarter
The change doesn't have to happen all at once. Start with three steps.
Step 1. Pick one outcome metric
Coverage of critical roles is the easiest to start with. To calculate it, you need three things:
- A list of your critical roles. These are the roles the business can't operate without. Most companies already have this from succession planning or business continuity work.
- The skills each role requires. These are usually in job descriptions, role guides, or competency frameworks.
- Who currently covers those roles, and how well. This comes from manager assessments, role-fit reviews, or performance data.
You probably already have all three. They just live in different systems. Connecting them is the work.
Step 2. Measure now, measure again in 3 months
Coverage is the overlap between three things:
- The roles on your critical list
- The skills each role requires
- The skills each employee has
Where those three line up, you get the number: the percentage of critical roles with full skill coverage today.
Write it down. That's your baseline.
Three months later, run the same calculation. Same roles. Same skill definitions. Same source for skills data.
When you report it, report the change. Not "76% coverage." Say "coverage moved from 71% to 76% in Q3."
That 5-point movement is your gap-closure rate for the quarter on critical roles.
The movement is the signal. A snapshot tells the C-suite a number. A trend tells them whether the function is working.
Connecting those three datasets is the structural piece most L&D functions are missing. The data usually exists. Putting it in one view is what makes quarterly measurement possible at all.
Step 3. Stop reporting training hours
Remove hours from the executive dashboard. Not reduce. Not move to a sub-page. Remove.
The L&D team will report on what's on the dashboard. If hours are there, they will chase hours. If hours are gone, they will chase the new metric.
The true test
In three months, at the next executive review, ask one question:
Did the capability gap shrink this quarter?
If the dashboard can answer it, the change is happening! If it can't, the dashboard is still a vanity dashboard.
That's the whole point. One honest confrontation between what you measure and what the business needs. Without it, the L&D function keeps reporting effort instead of concrete outcomes


.jpg?width=300&name=Talentguide%20(1).jpg)
